Three-Dimensional plotting
Python allows to build 3D charts thanks to the mplot3d toolkit of the matplotlib library. However, please note that 3d charts are most often a bad practice. This section focuses on 3d scatter plots and surface plots that are some interesting use cases.
⏱ Quick start
The mplot3d toolkit of matplotlib is used here.
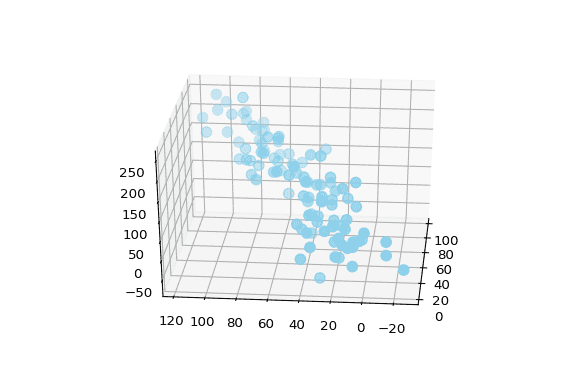
- The projection parameter of the add_subplot() function is set to
3d - The usual
scatter()function can now be called with 3 data inputs for the X, Y and Z axis - The camera position can be set thanks to the
view_init()function
# libraries
from mpl_toolkits.mplot3d import Axes3D
import matplotlib.pyplot as plt
import numpy as np
import pandas as pd

# Dataset
df=pd.DataFrame({'X': range(1,101), 'Y': np.random.randn(100)*15+range(1,101), 'Z': (np.random.randn(100)*15+range(1,101))*2 })

# plot
fig = plt.figure()
ax = fig.add_subplot(111, projection='3d')
ax.scatter(df['X'], df['Y'], df['Z'], c='skyblue', s=60)
ax.view_init(30, 185)
plt.show()
⚠️ Mind the 3d
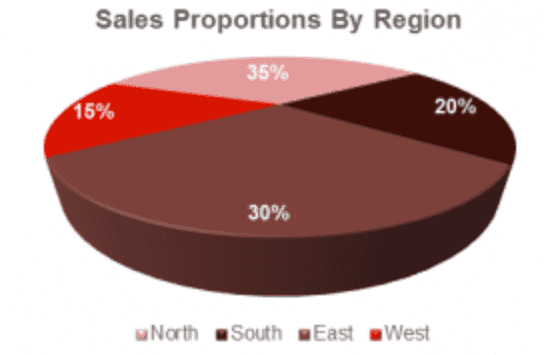
Three dimensional objects are very popular but negatively affect the accuracy and speed at which one can interpret a graphic in most cases.
In the example below, the brown section in front looks much bigger than the pink section in the back, even tough their real values are 30% vs 35%. Data is distorted.
Note: remember pie charts should be avoided most of the time
 Three-dimensional scatterplots with
 Matplotlib
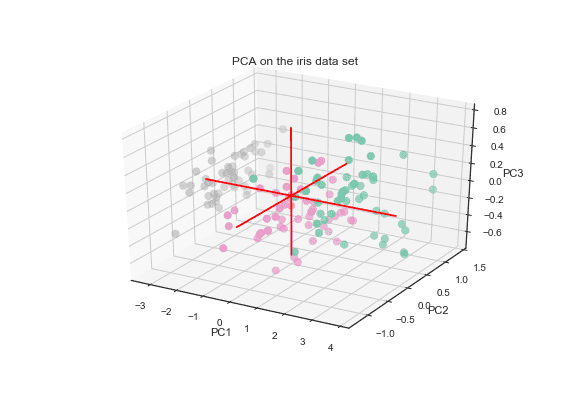
As described in the quick start section above, a three dimensional can be built with python thanks to themplot3d toolkit of matplotlib. The example below will guide you through its usage to get this figure:
This technique is useful to visualize the result of a PCA (Principal Component Analysis). The following example explains how to run a PCA with python and check its result with a 3d scatterplot:
 Surface plot with
 Matplotlib
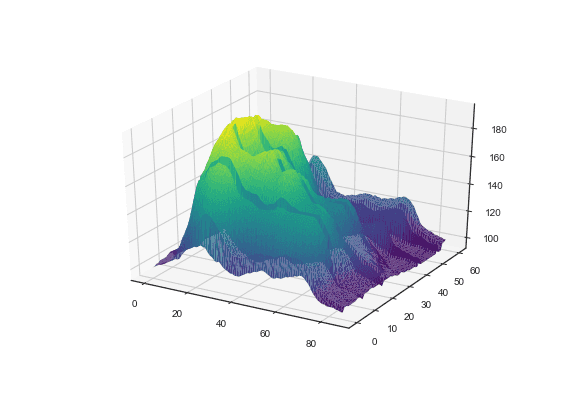
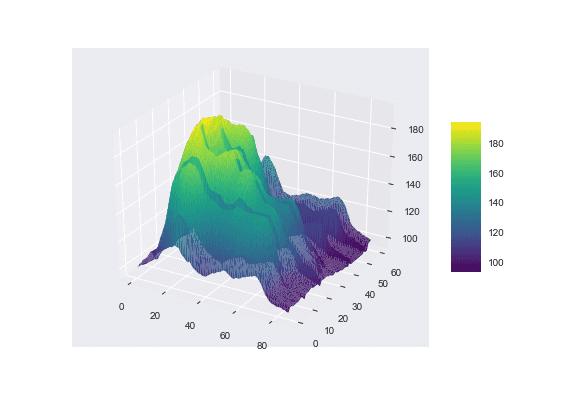
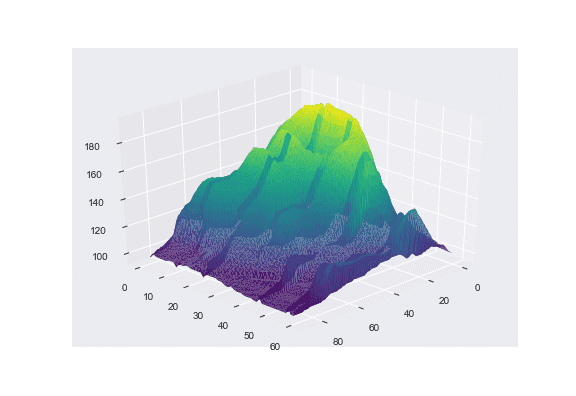
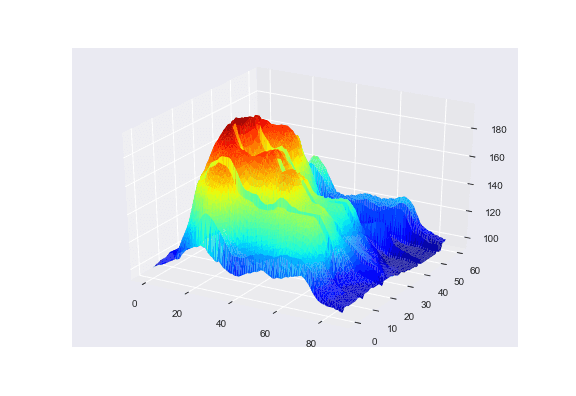
A surface plot considers the X and Y coordinates as latitude and longitude, and Z as the altitude. It represents the dataset as a surface by interpolating positions between data points.
This kind of chart can also be done thanks to the mplot3d toolkit of matplotlib. The posts linked below explain how to use and customize the trisurf() function that is used for surface plots.
 Three dimensional plot and animation
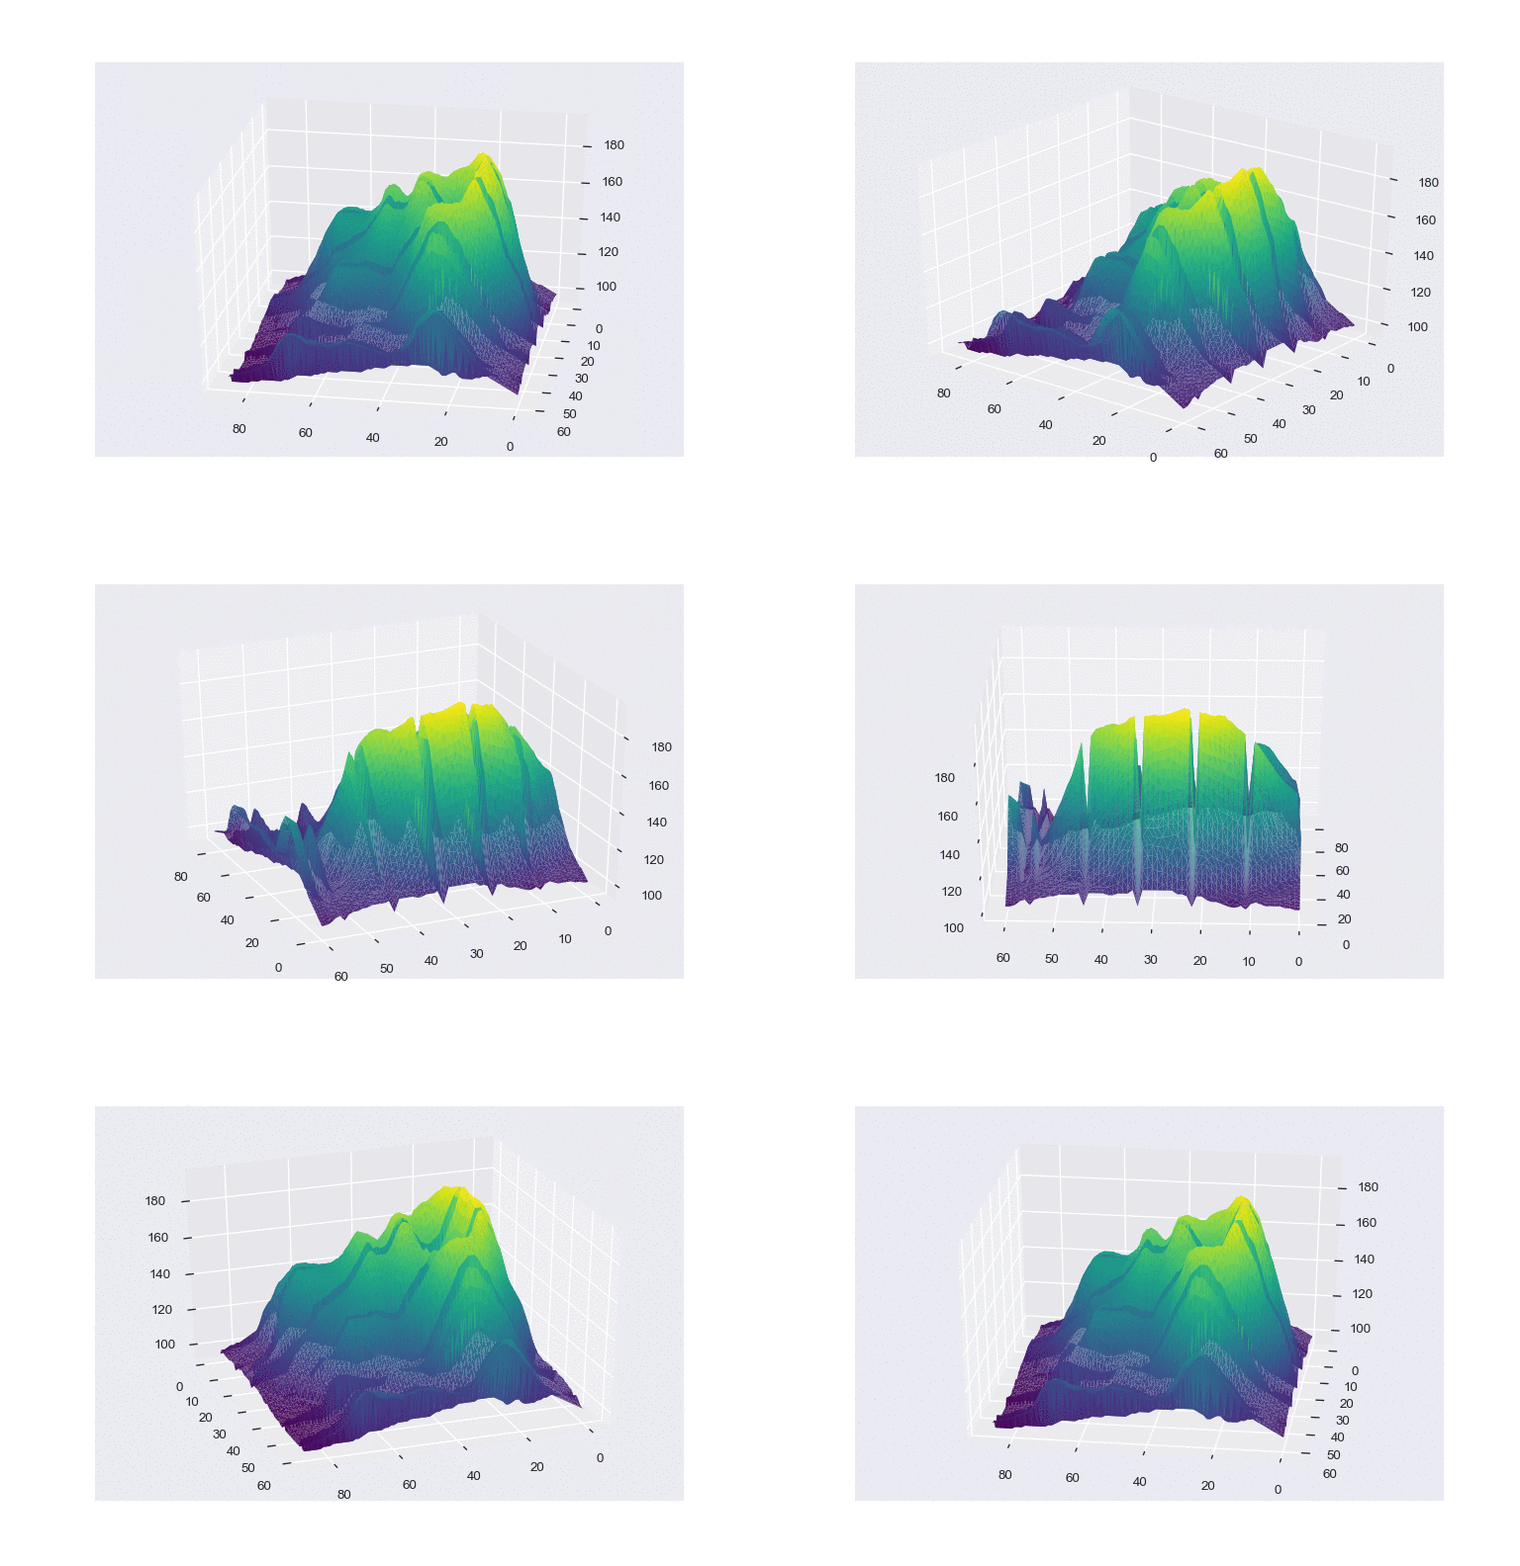
You can build an animation from a 3d chart by changing the camera position at each iteration of a loop. The example below explains how to do it for a surface plot but visit the animation section for more.
Contact
👋 This document is a work by Yan Holtz. You can contribute on github, send me a feedback on twitter or subscribe to the newsletter to know when new examples are published! 🔥
