📍 Basic scatterplot
Let's start by building a very basic scatterplot. This is extensively described in the scatterplot section of the gallery, so let's go straight to the point:
# libraries
import matplotlib.pyplot as plt
import seaborn as sns

# grey background
sns.set_theme(style="darkgrid")

# Scatterplot with 1 data point
plt.scatter(1, 10, s=600, alpha=0.5, edgecolors="grey", linewidth=2)
plt.xlim(0, 10)
plt.ylim(0, 100)
plt.show();
🔁 Loop
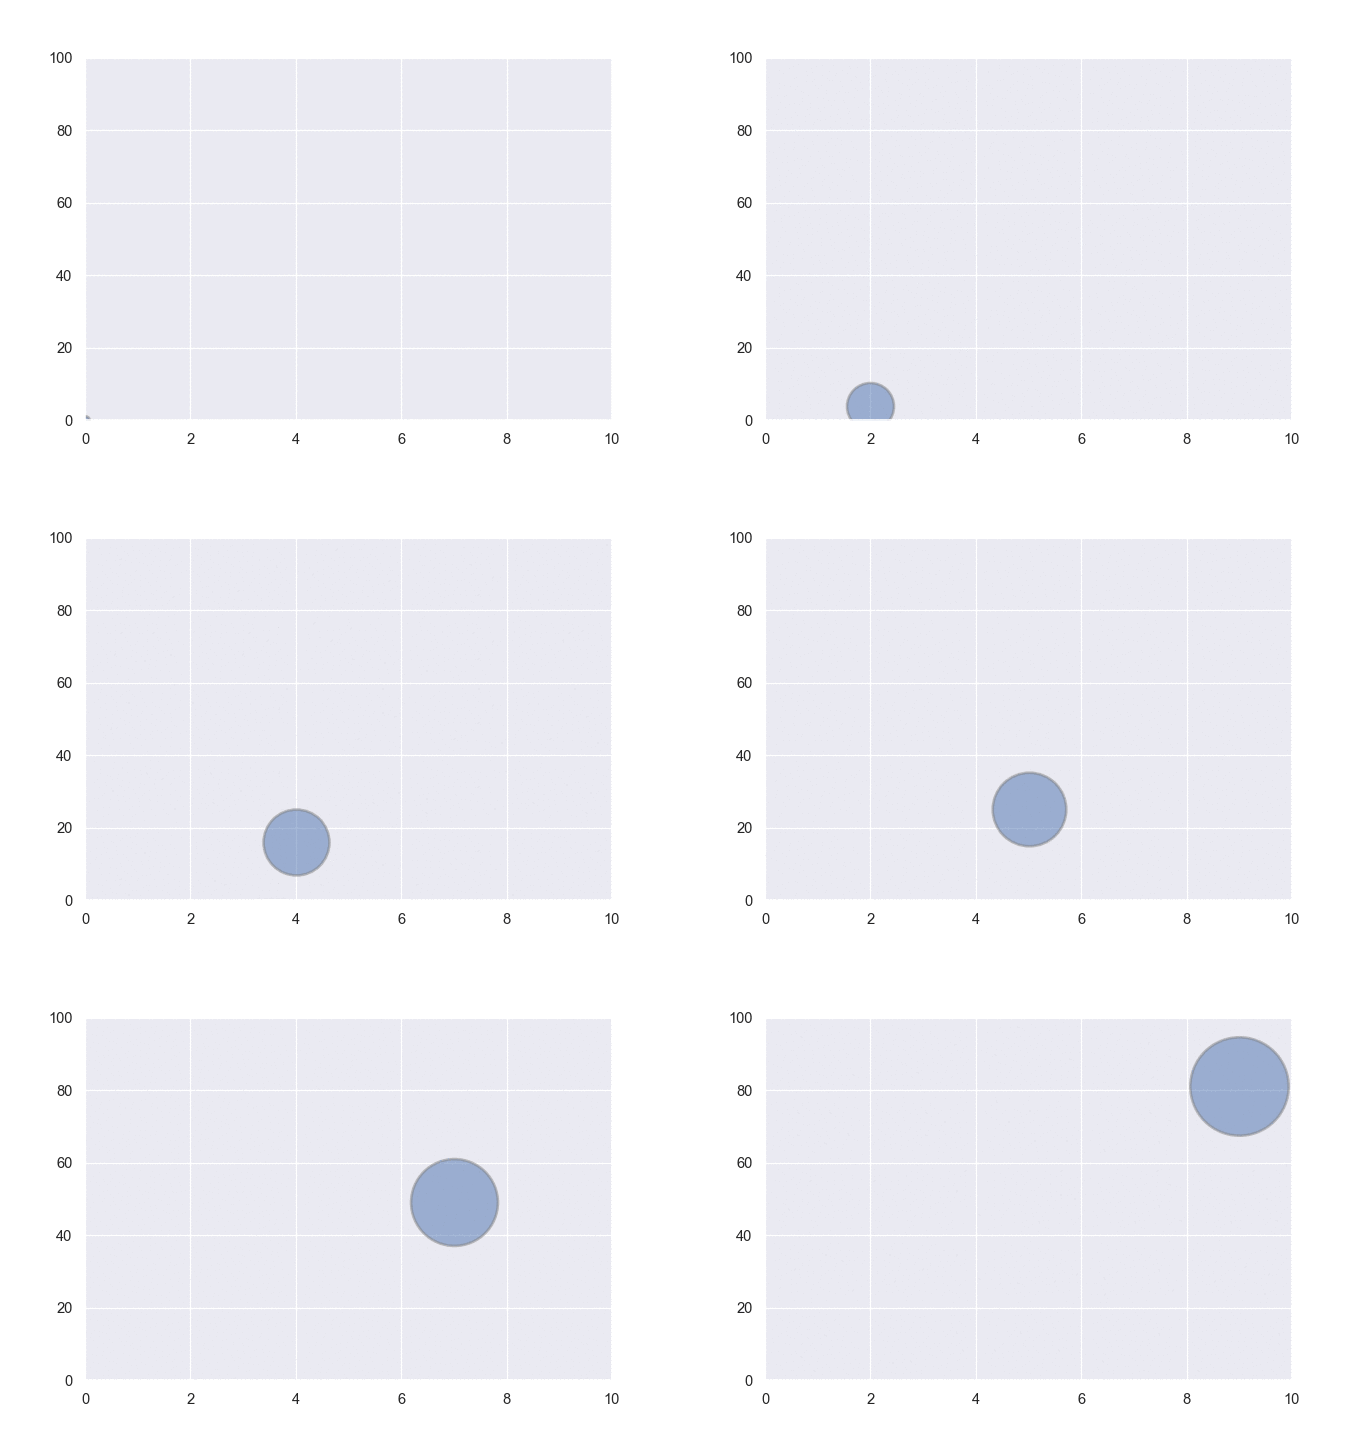
That was easy. Now let's build a loop that will produce this kind of chart at .png format at each iteration. For each step of the loop, the circle will be slightly moved toward the top right side of the figure:
# image resolution
dpi=96

# For each year:
for i in range(0,10):

    # initialize a figure
    fig = plt.figure(figsize=(680/dpi, 480/dpi), dpi=dpi)

    # Build the scatterplot
    plt.scatter(i, i*i, s=40+i*600, alpha=0.5, edgecolors="grey", linewidth=2)
    plt.xlim(0, 10)
    plt.ylim(0, 100)

    # Save it & close the figure
    filename='/Users/yan.holtz/Desktop/Scatter_step'+str(i)+'.png'
    plt.savefig(fname=filename, dpi=96)
    plt.gca()
    plt.close(fig)
Now, you should have a set of 12 images in the specified folder (/Users/yan.holtz/Desktop/ for me). Image magick is a command line tool that allows to concatenate those images in a gif file.
✨ Build a Gif
Install ImageMagick with this line of bash:
brew install imagemagick
If you don't have brew installed, visit the image magick homepage for explanations.
Once the tool is installed, you can concatenate the 12 images using the following command:
# Bash
# convert -delay 80 Scatter*.png animated_scatter.gif
Note: the above line of code is written in
bash, not inpython. You have to execute it in a terminal, not in your python environment.
And here is the final result 


