Cheat Sheets
This section provides a few cheat sheets related with python, data wrangling and data visualization. Even with a perfect understanding of python and its libraries, it's almost impossible to remember the syntax of each function of the ecosystem. That's where cheatsheets are useful 🔥!
 Matplotlib cheatsheet
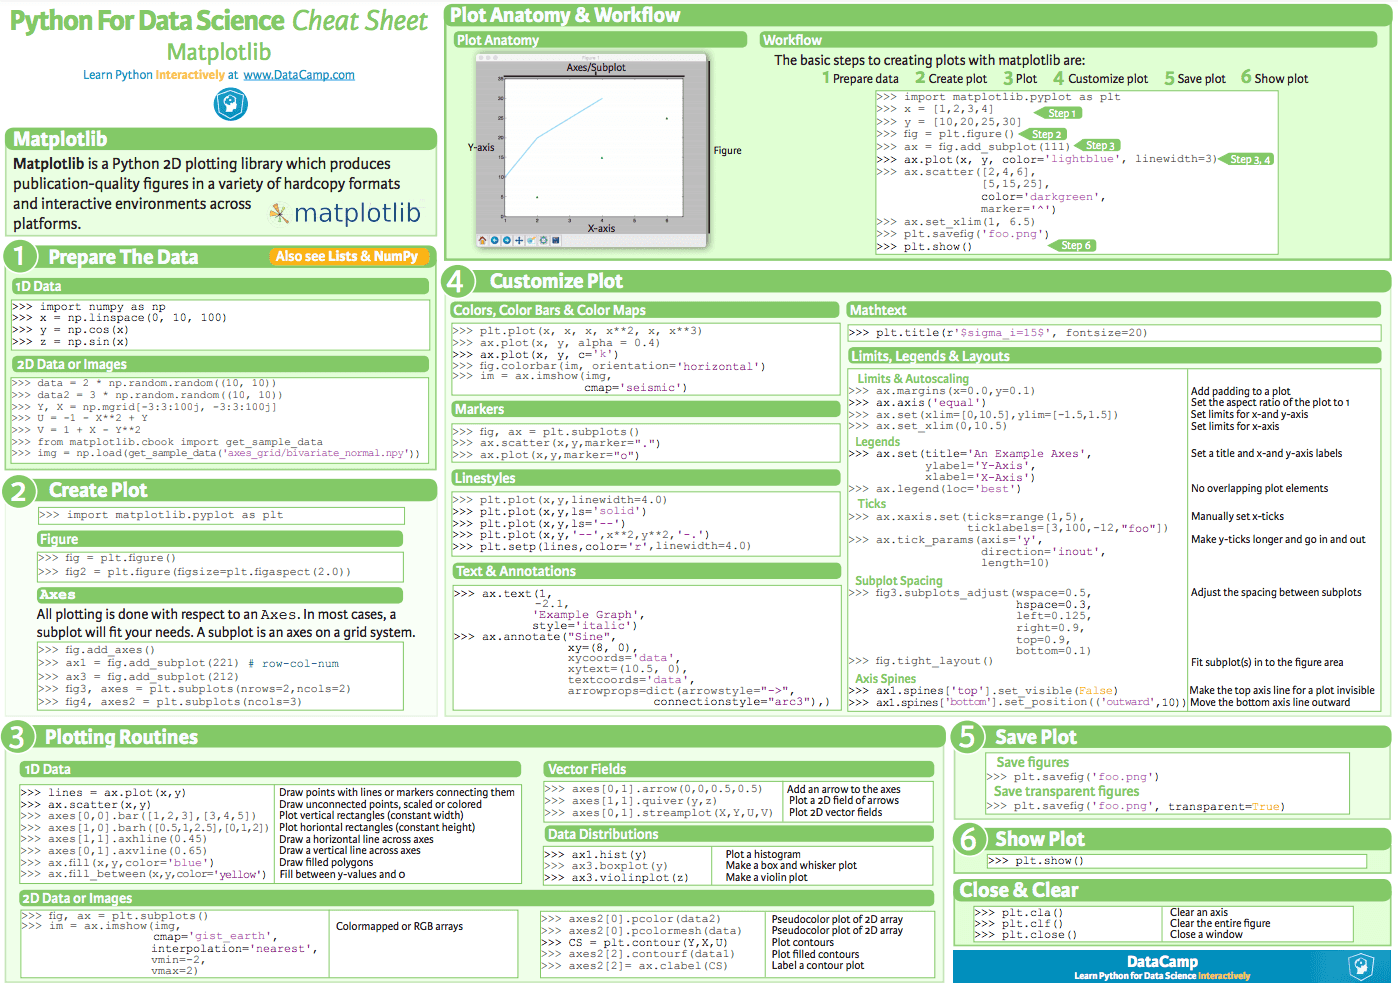
Datacamp provides a cheatsheet describing the basics of matplotlib. Matplotlib is the most widely used library for datavisualization with python. You can read more about it on its dedicated page.
The following 2 cheatsheets from the official matplotlib repository are also very handy:
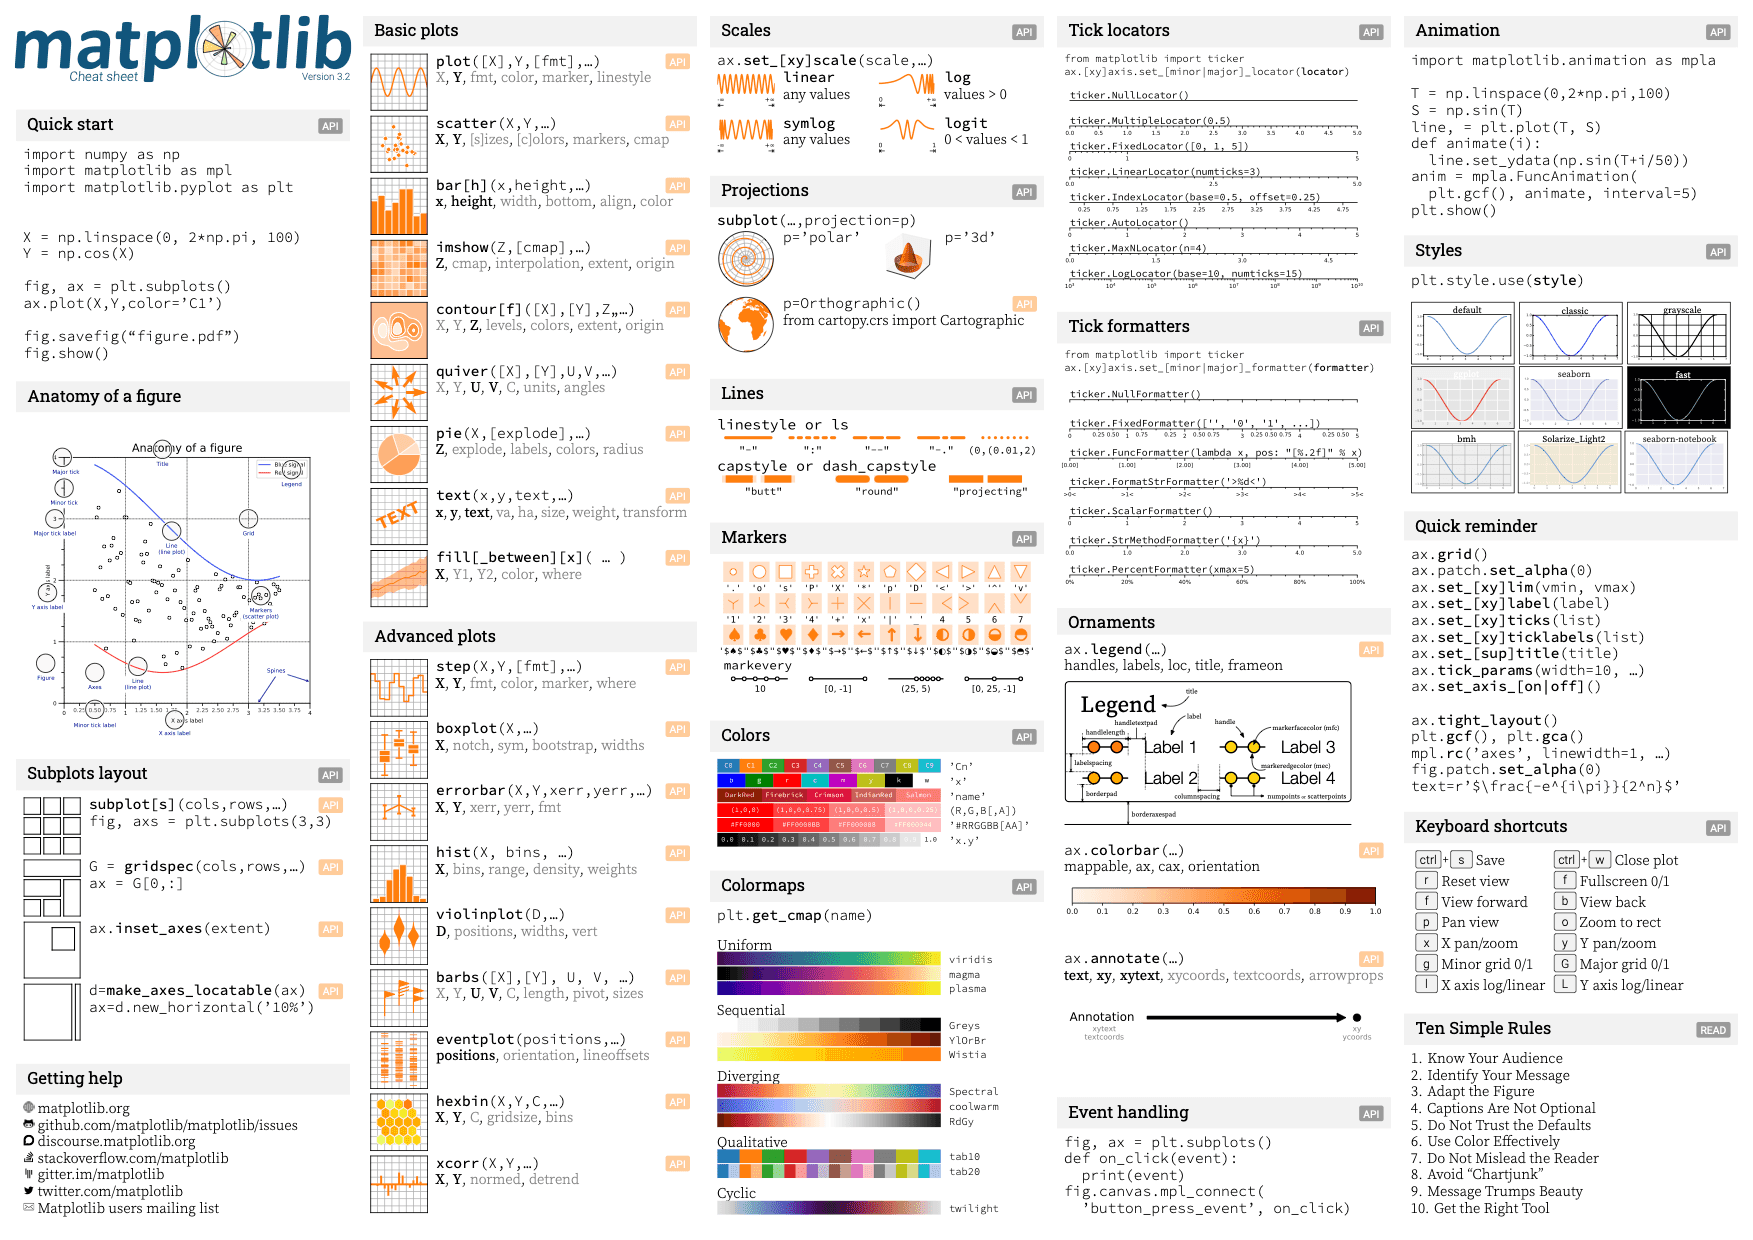
Matplotlib cheatsheet by matplotlib (page 1).
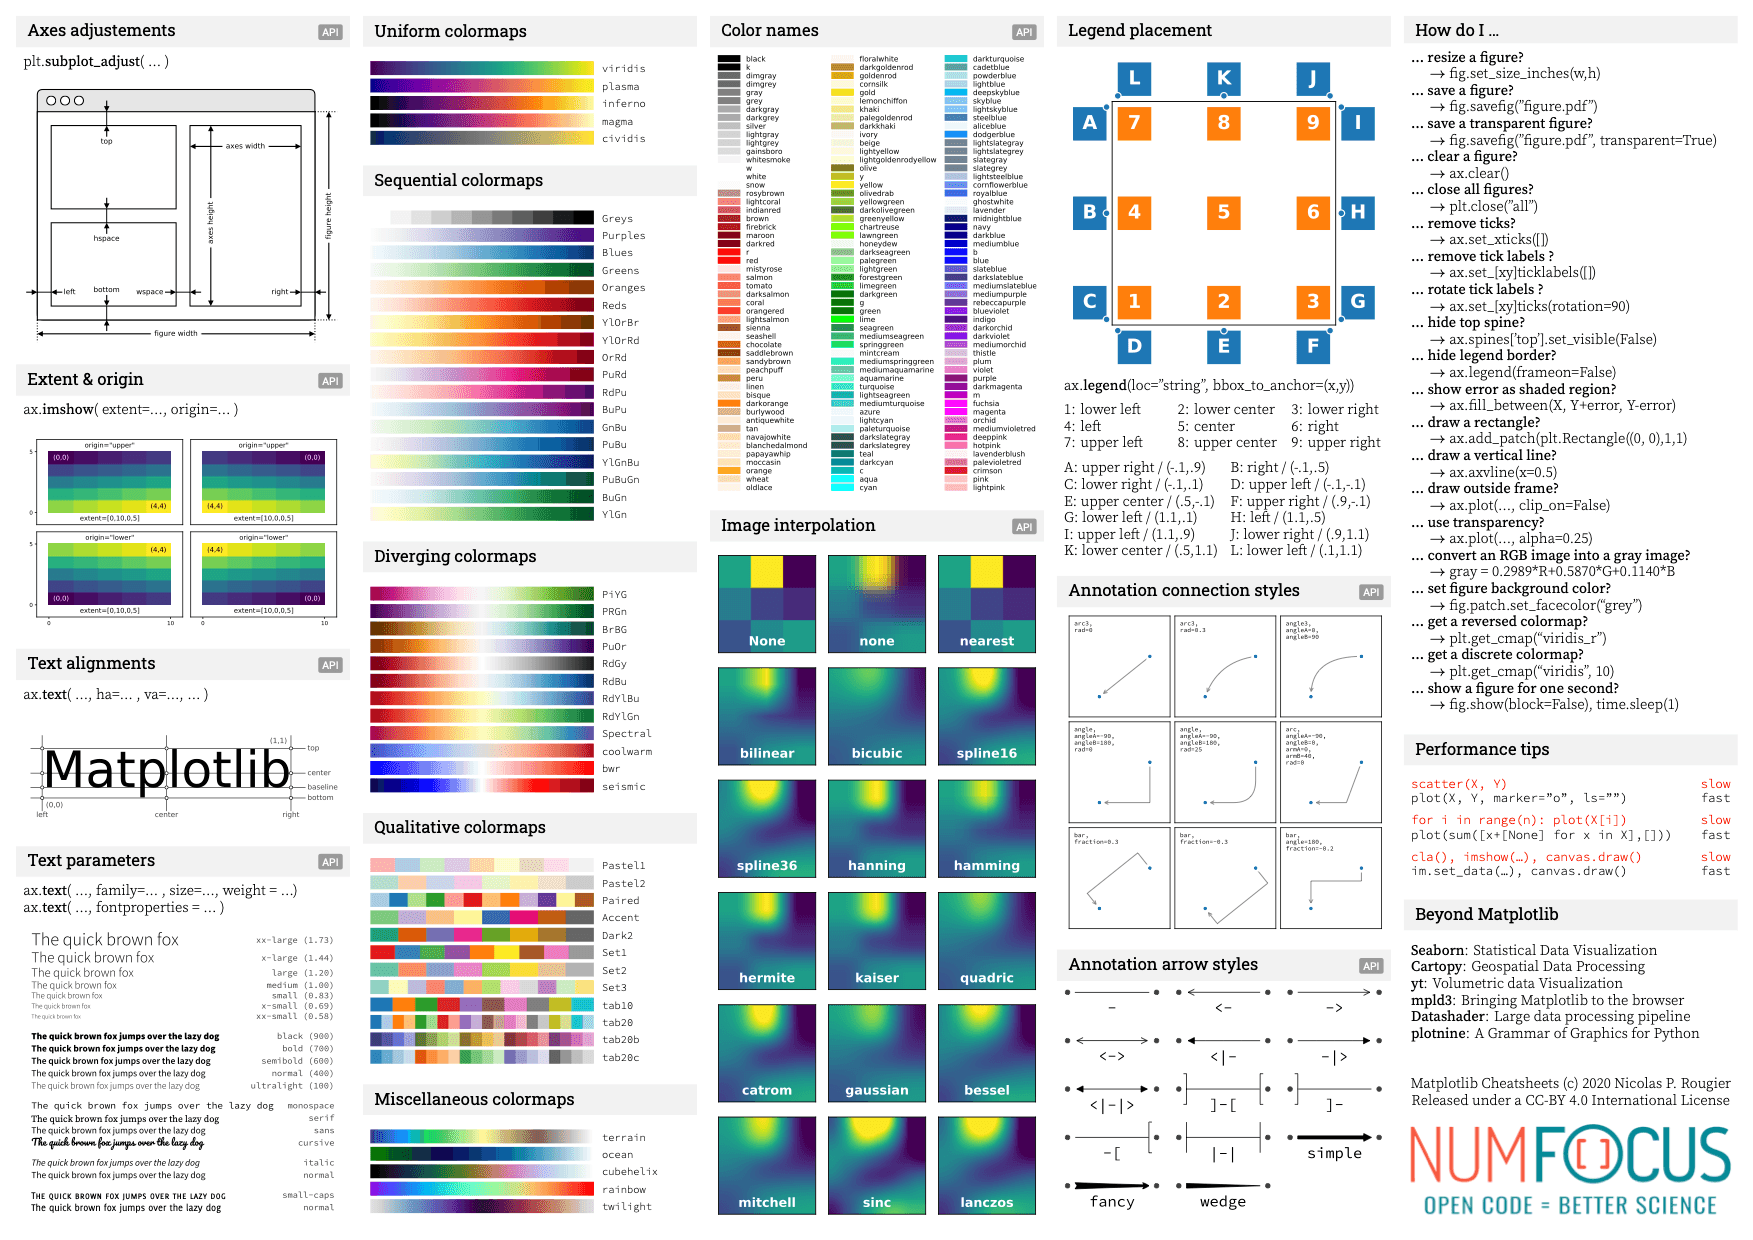
Matplotlib cheatsheet by matplotlib (page 2).
 Seaborn cheatsheet
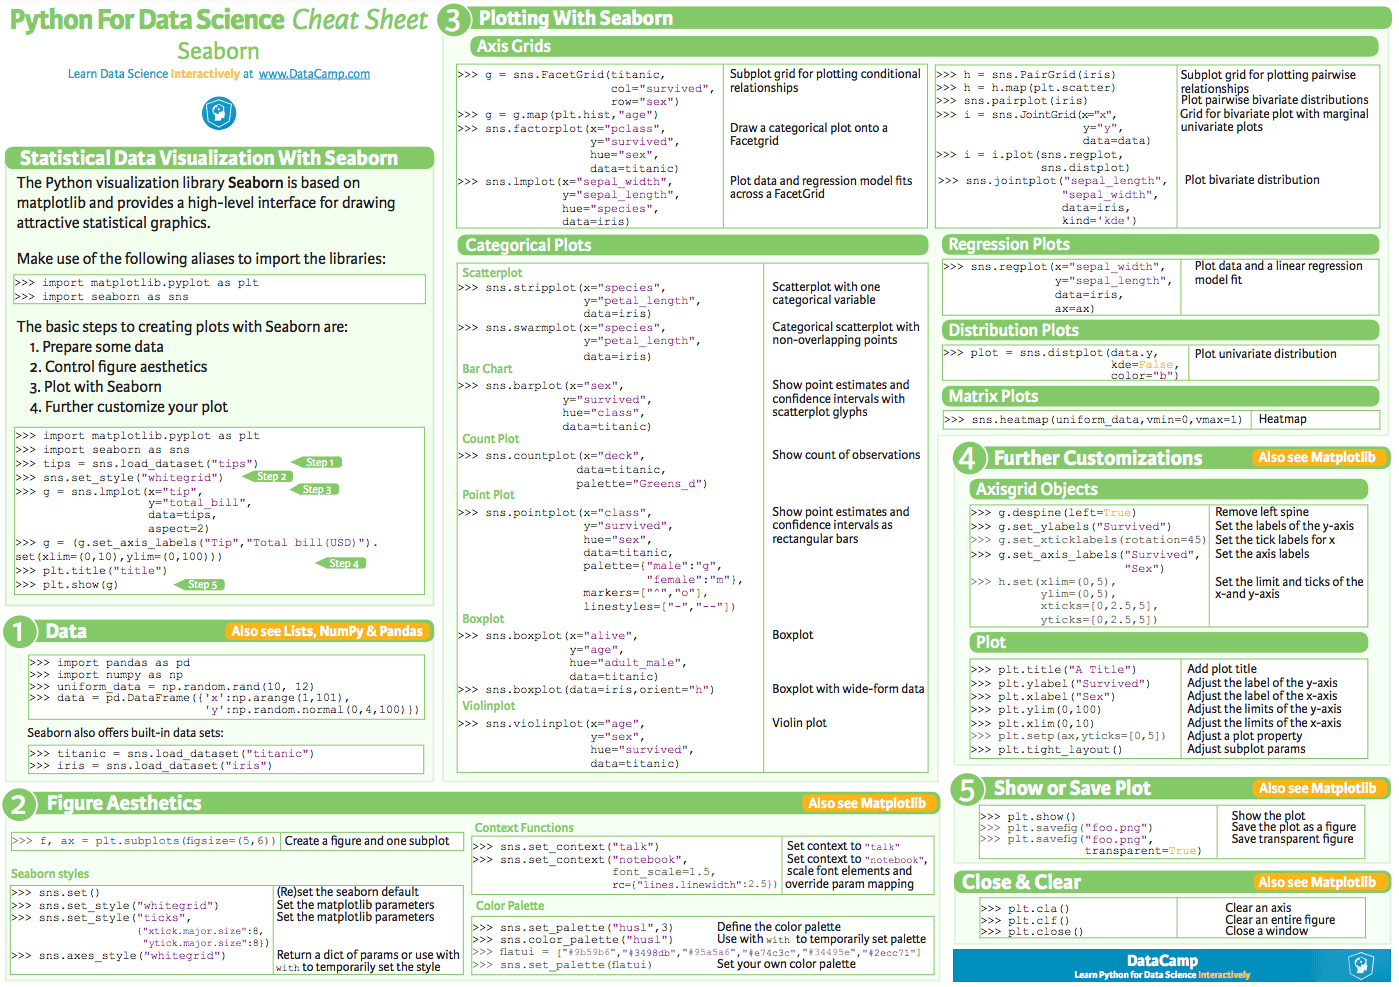
Datacamp provides a cheatsheet describing the basics of seaborn. Seaborn is also a widely used library for datavisualization with python. It allows to get very clean chart with less code. You can read more about it on its dedicated page.
 Pandas cheatsheet
Datacamp provides a cheatsheet describing the basics of pandas. Pandas is mainly used for data manipulation with Python, but also offers some dataviz helpers.
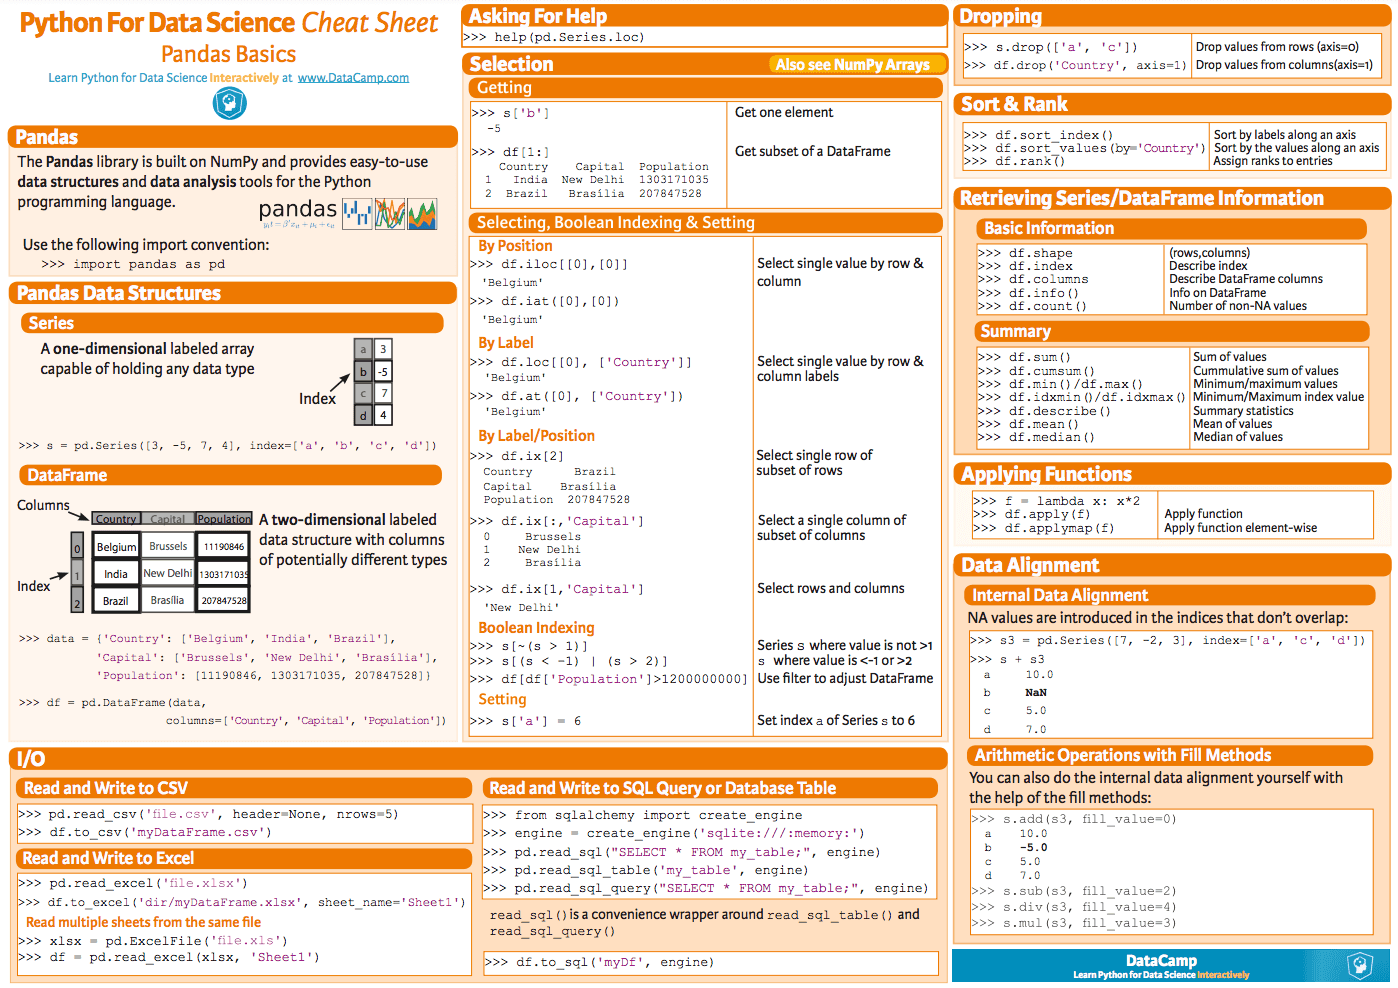
Pandas cheatsheet by Datacamp.
