Circular Packing
A treemap displays hierarchical data as a set of nested rectangles. Each group is represented by a rectangle, which area is proportional to its value. In Python, the squarify library allows to compute the rectangle positions and plot it.
 One level of hierarchy
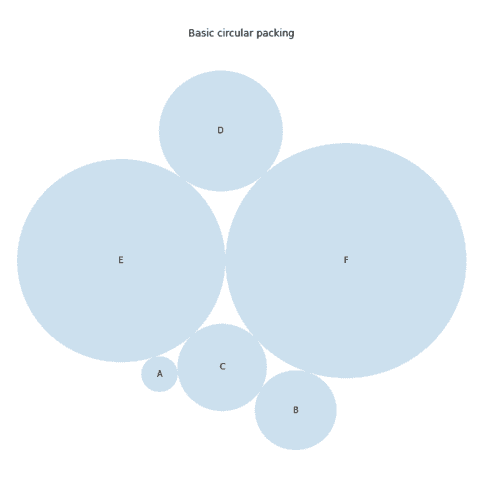
Circlify can work without a hierarchical structure, i.e. with just a set of numeric varialbles that will be each displayed as a bubble. Note that the package just compute the position and size of each bubble. Once that's done, matplotlib is used to make the chart itself with usual functions.
 Several levels of hierarchy
Circlify also works from a hierarchical structure. Bubbles representing the bottom of the hierarchy are encapsulated into higher hierarchy bubbles and so on. Note that the process is a bit more tedious here, but still doable thanks to matplotlib.


