Dendrogram
A dendrogram is a network structure. It is constituted of a root node that gives birth to several nodes connected by edges or branches. It is used to represent a hierarchical structure or to display the result of a clustering algorithm.
 Dendrogram for clustering with
 Matplotlib
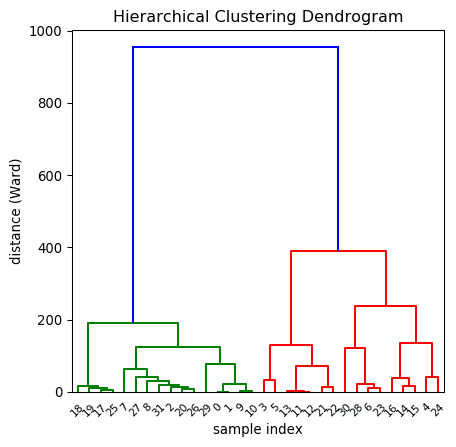
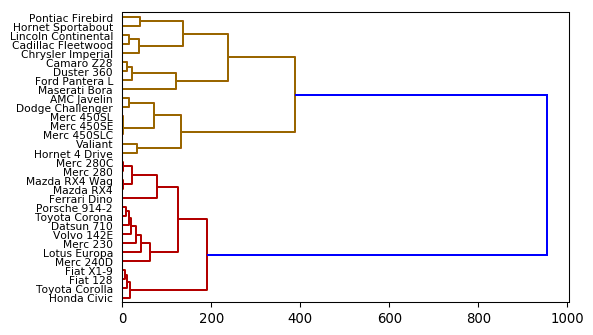
The first chart of this section explains how to build a basic dendrogram with Python andmatplotlib. It starts from a numeric matrix, compute the similarity between each pair of item thanks to the linkage() function and plot the result with the dendrogram() function.
The next post explains how to customize the output: change node and edge features like color and shapes, select a specific part of the tree and more.
 Dendrogram, clustering and heatmaps with
 Seaborn
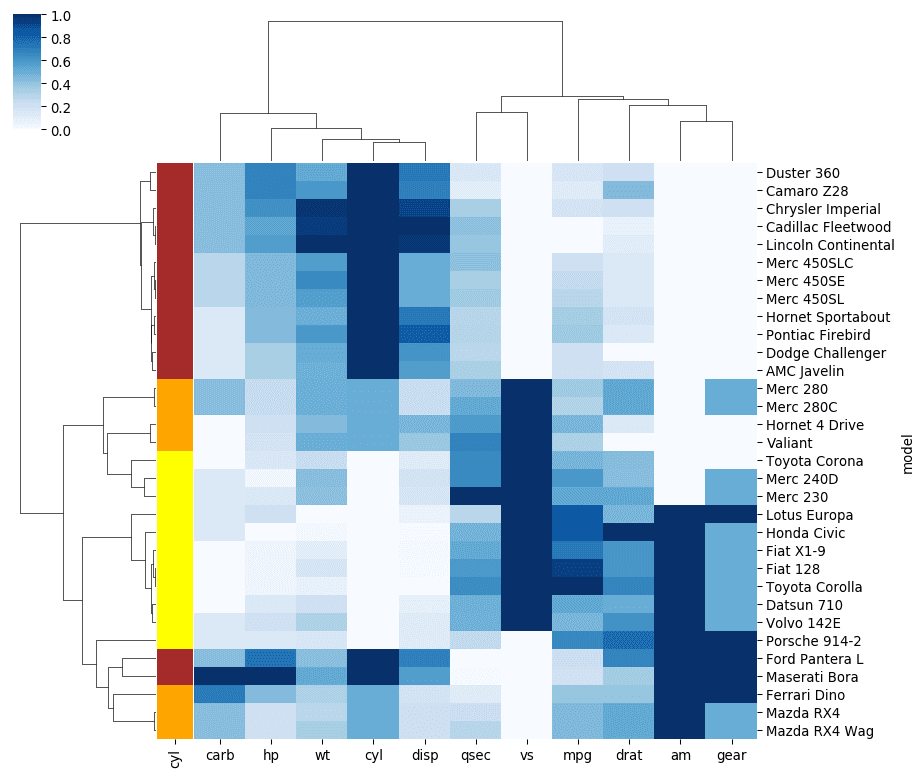
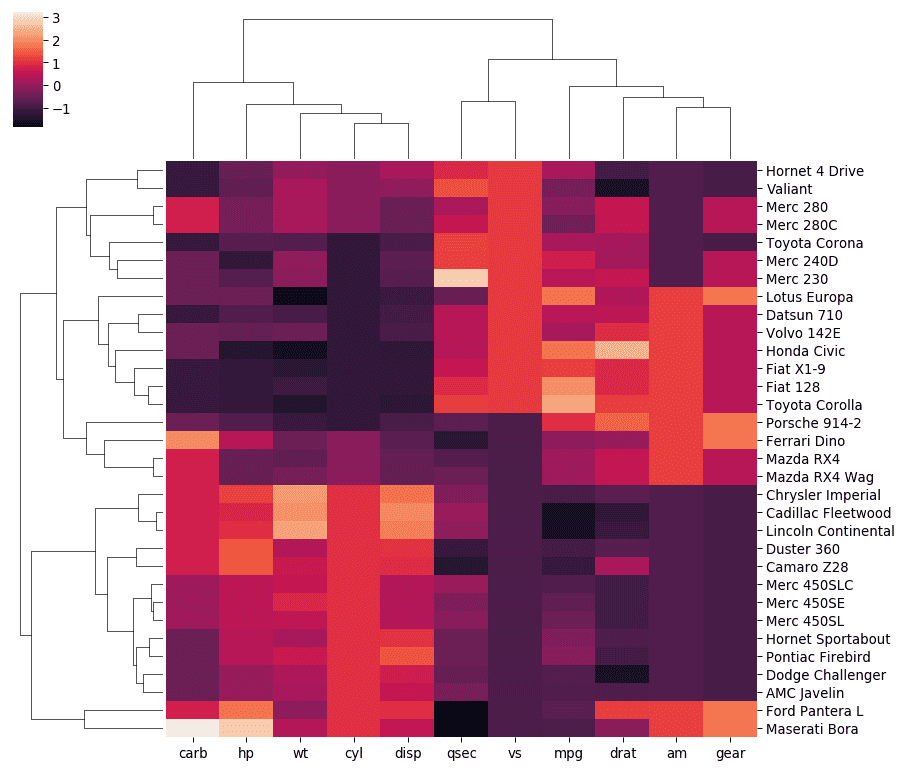
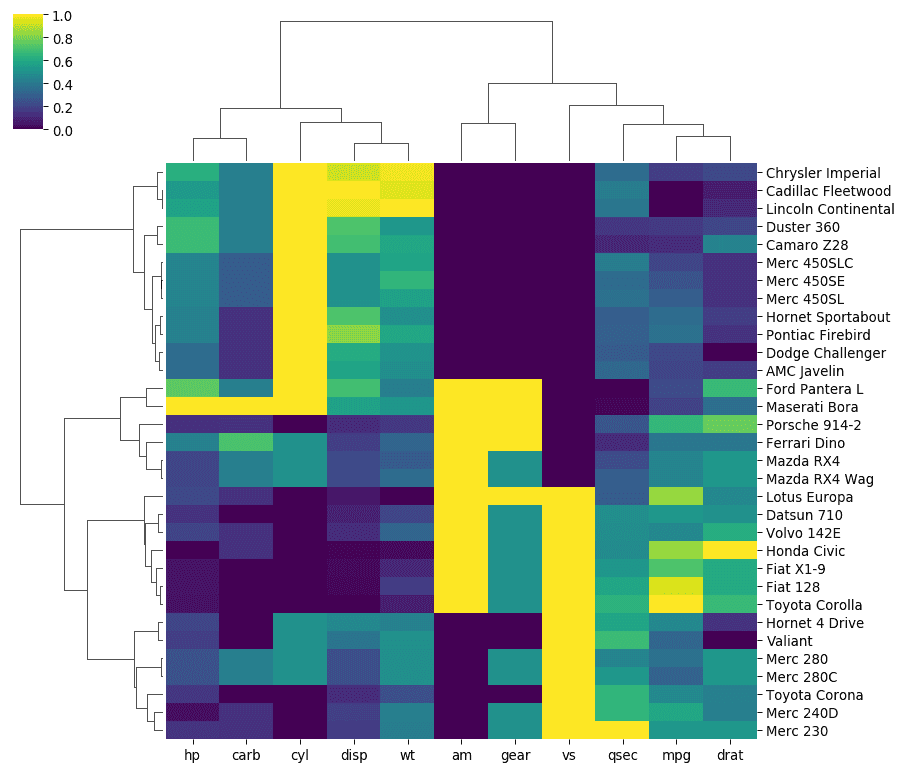
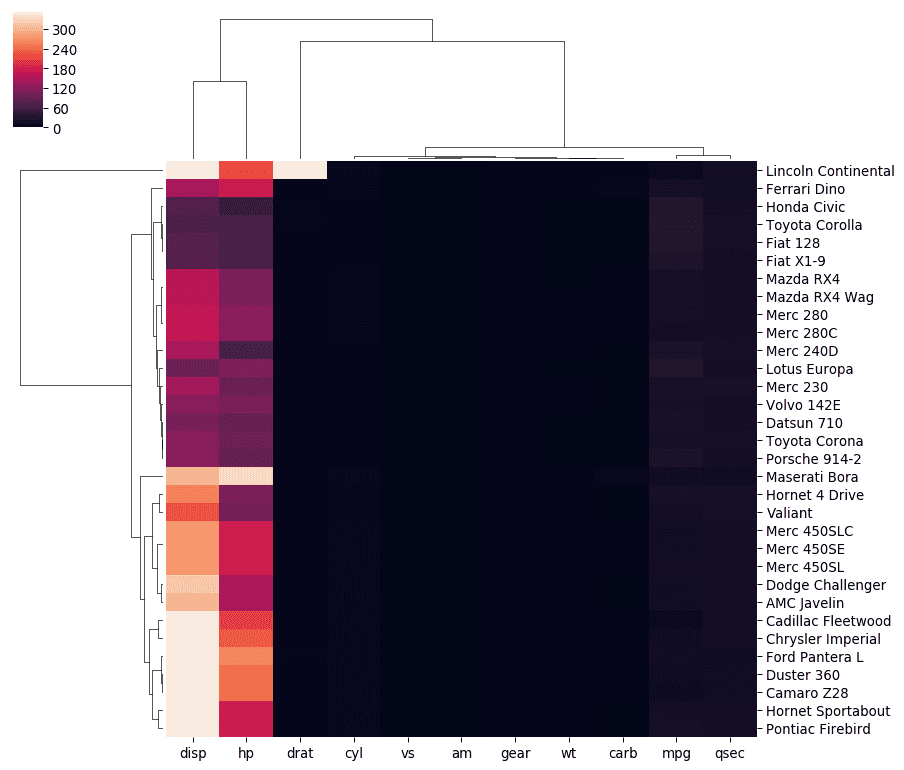
It is very common to display the results of a clustering using a heatmapwith dendrograms around it. Fortunately the Seaborn library makes it a breeze.
The examples below will guide you through the most usual needs. Note however that data normalization should be your main focus here, as it can massively impact the final visual result. (See this post for that).
Dendrogram for hierarchical datasets
Dendrogram can also be used to display a hierarchy. A hierarchy as a root node that gets divided in several children and so on.
TODO
