Pie Plot

A Pie Chart is a circle divided into sectors that each represent a proportion of the whole. It is one of the most common viz type, but also probably the most criticized. In python, they are most of the time done thanks to the pie() function of the Matplotlib library.
⏱ Quick start
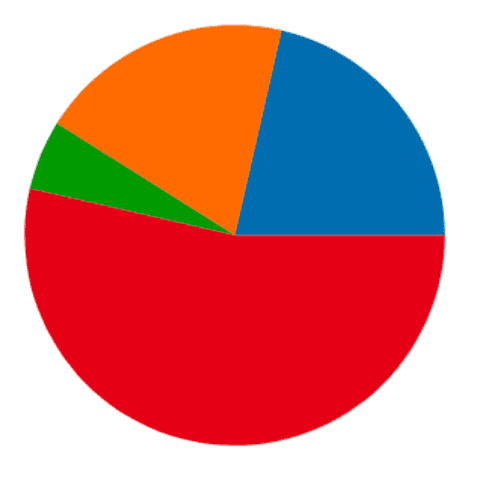
matplotlib allows to build a pie chart easily thanks to its pie() function.
The input data you must provide is an array of numbers, where each numbers will be mapped to one of the pie item.🔥
# library
import matplotlib.pyplot as plt

# create data: an array of values
size_of_groups=[12,11,3,30]

# Create a pieplot
plt.pie(size_of_groups)
plt.show()
⚠️ Mind the pie chart
Pie chart is probably the most criticized chart type. Humans are pretty bad at reading angles, making it hard to rank the groups accurately. Most of the time, it is better to display the information as a barchart, a treemap or a lollipop plot.
Have a look to the 3 pie charts below, can you spot the pattern hidden in it?
Last but not least, please avoid the explode and shadow options of the pie() function, they are killing all the most basic dataviz principles.
 Pie chart with
 Matplotlib
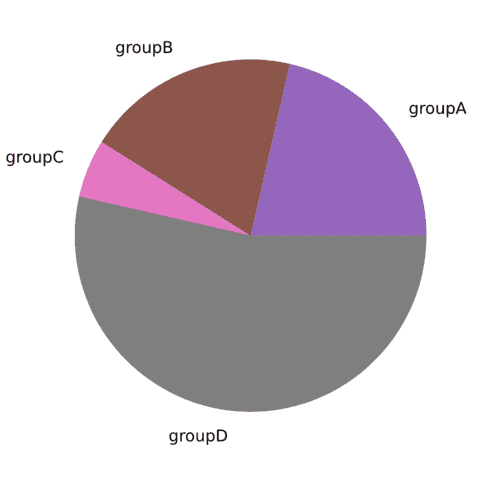
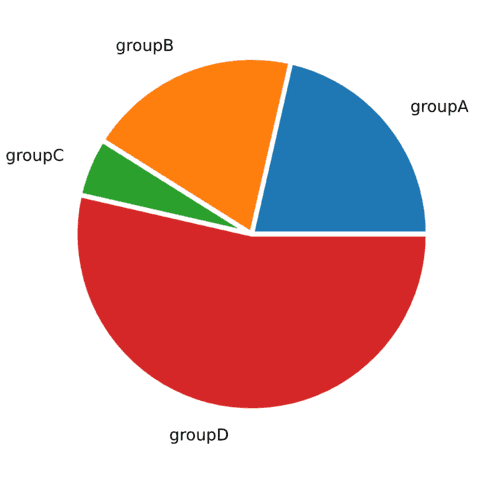
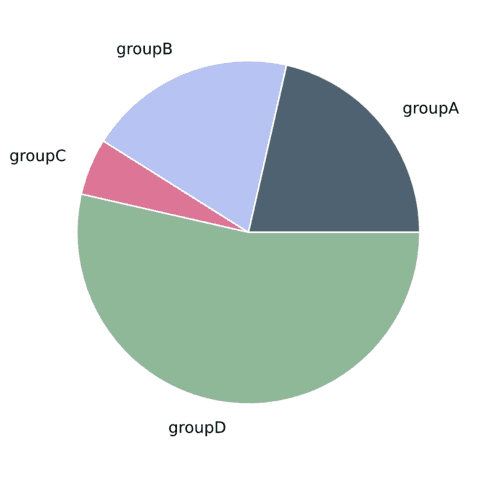
The examples below should guide you through the pie() function usage. It starts basics and then show how to add labels, customize colors and more.
🚨 Grab the Data To Viz poster!
Do you know all the chart types? Do you know which one you should pick? I made a decision tree that answers those questions. You can download it for free!


